Apply for a scholarship (up to 25% Scholarship until 31st of October 2025)
Apply for a scholarship (up to 25% Scholarship until 31st of October 2025)
Programs features
Learning Formula
Online/Blended
Intake
2 Times A Year
Language
English
Get to know about this short course and what it offers
- Overview
- Program Structure
- Awarding Institutions and Title
- Program Completion
- Benefits
- Learning Objectives
- Eligibility and Application
- Faculty
This comprehensive Diploma in Data Science is meticulously designed to equip participants with the skills and knowledge essential to excel in data analysis and visualization.
A diploma in data science provides numerous benefits, including: gaining foundational skills in data analysis, opening doors to entry-level data science roles, and enhancing career prospects across industries. Participants develop proficiency in data analytics tools such as Structured Query Language (SQL), Advanced Excel, ETL Operations, Power Query, and Power BI, while mastering data cleaning in Excel and advanced data visualization techniques. Additionally, they acquire a robust understanding of statistical methods, which are vital for interpreting data effectively. This diploma is an invaluable stepping stone for individuals seeking to enter the data science field without committing to a full bachelor’s degree.
The Diploma in Data Science Program transforms students from beginner-level analysts into advanced and expert-level professionals. It guides participants through a comprehensive learning journey, equipping them with the skills, tools, and techniques needed to thrive in the evolving world of data science and business analytics.
Whether you aspire to become a data professional, business leader, or are simply looking to future-proof your career, this Diploma in Data Science ensures you gain job-ready skills and earn a globally recognized certification from the Skill Development Council, Canada. Designed with flexibility in mind, it addresses the growing demand for expertise in data-driven decision-making and empowers participants to excel in data science career opportunities.
- Duration: 4 Months (Online)
- Learning Format: Online + Live Webinars + LMS Access
- Tuition: NGN 400,000 (Flexible payment plans available)
- Schedule: Saturday – Sunday (9:00 AM – 1:00 PM) | Sunday (1:00 PM – 5:00 PM)
- 2 Cohorts (June and October 2025)
Skill Development Council, Canada
- Diploma in Data Science
Docenti Global Business School
- Certificate in Data Science
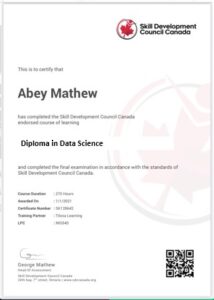
Skill Development Council Canada Sample Certificate.
- 2 Months Internship
- Assessments and Capstone Project
1. Double Certification:
Earn a recognized diploma from Docenti Global Business School and Skill Development Council, Canada.
2. Internship Opportunities:
Gain 3 months of hands-on industry experience to strengthen your expertise.
3. Capstone Project:
Apply your knowledge to solve real-world data challenges.
4. International Study Tour:
Participate in boot camps and study tours to Thailand and Rwanda.
5. Networking & Career Support:
Connect with top companies, career coaches, and like-minded professionals.
6. International Network Opportunities:
Expand your global network and access new career opportunities.
7. Business Incubation:
Receive support and resources to launch your own business.
8. Exposure to the Corporate Community:
Connect with top companies and industry leaders.
9. Career Service:
Receive personalized career coaching and support.
10. Use of Docenti LMS:
Access our state-of-the-art learning management system for one year.
11. Discounts on Programs:
Receive exclusive discounts on our programs and partner courses.
12. Coaching and Mentoring:
Receive personalized coaching and mentoring from industry experts.
13. Free Webinars:
Access exclusive webinars and online events.
Our Diploma in Data Science program is meticulously designed to guide students from foundational principles to advanced data analytics techniques. Participants will gain expertise in data science and artificial intelligence, equipping them with the skills necessary for extracting, transforming, and loading data efficiently.
Extract, Transform, and Load – Master Data Processing
Students will develop proficiency in data processing, enabling them to gather and import data from multiple sources, including CSV files, databases, and APIs. They will learn strategies for data analysis in Excel, effectively handling missing values, duplicates, and structuring raw data for data analytics. By mastering these techniques, participants will become adept at data visualization and data analysis, empowering them to make informed business decisions.
Excel Proficiency for Data Analysis
The Introduction to Excel and Advanced Excel modules will provide students with data transformation capabilities using Microsoft Excel, a critical tool in data analytics and Excel-based data science. Through pivot tables, formulas, and automation techniques, participants will advance from beginner to expert in data science and analytics.
Efficient Data Management with SQL
The Diploma in SQL, a core component of the Diploma in Data Science, offers participants the ability to efficiently query, manage, and analyze large datasets. This module covers essential data science and analytics techniques, including SELECT, WHERE, GROUP BY, and JOIN operations, facilitating structured data processing and analytics.
Mastering Data Visualization with Power BI
Through the Diploma in Power BI, students will learn to utilize Power BI and data visualization tools to convert data from multiple sources into interactive dashboards and business intelligence reports. This specialized module ensures proficiency in data science data visualization using Microsoft Power BI, a leading tool in computing science and artificial learning.
Eligibility:
- Computer and Internet Access: Ensure you have a computer or laptop with a stable internet connection to access course materials and online resources for your data analytics course or online data science course.
- Basic Computer Skills: Familiarity with using a computer, web browsers, and basic file management will facilitate your learning process, especially when working with tools like SQL and Advanced Excel.
- Data Analysis Tools: Install essential tools such as Excel, SQL environments, and Power BI to participate in practical exercises and projects that align with real-world business analytics applications.
- Desire to Learn: Data analysis can be challenging, but a positive attitude and a genuine passion for data-driven decision-making will drive your success in the evolving field of data science.
Application:
Applicants are required to prepare the following documents:
- Identification Document: National ID card or passport.
- Educational Certificate: Proof of prior academic achievements to ensure readiness for advanced data science career opportunities.

RAYMOND OKORO
FACULTY MEMBER DOCENTI GLOBAL BUSINESS SCHOOL
Okoro Raymond, Ph.D. Technology Executive, Digital Transformation Leader With 17+ years of experience, Dr. Okoro drives innovation and digital transformation. As CIO (Novatrack) and CTO (Softworldinc), he leads engineering teams, DevOps, and Big Data/AI-driven logistics and enterprise systems.His expertise in Digital Transformation, Big Data Analytics, and enterprise automation has impacted 20M+ users worldwide. Dr. Okoro has led initiatives in edtech, fintech, ERP, and SaaS, and is dedicated to mentoring the next generation of tech leaders.

DAVID AGBOOLA
FACULTY MEMBER OF DOCENTI GLOBAL BUSINESS SCHOOL
David Agboola is a seasoned Business Strategist and Growth Marketer with expertise in digital marketing, business transformation, and personal branding. With over six years of experience, he has helped businesses across real estate, fintech, edtech, and consulting industries scale through data-driven marketing strategies and innovative business solutions.As a faculty member at Docenti Global Business School, David brings practical insights and real-world case studies into the classroom, equipping students with industry-relevant skills in digital marketing, sales funnels, media buying, and growth hacking. He holds an MSc in Digital Marketing and Business Transformation from Rome Business School and has earned professional certifications from Google, HubSpot, and McKinsey Forward. Through his consulting firm, Citilite Media Solutions, he has worked with clients in Nigeria, the UK, the US, and Canada, helping them refine their marketing strategies and increase revenue.David is passionate about empowering the next generation of business leaders and entrepreneurs through innovative marketing strategies, AI-powered digital solutions, and high-impact business education.

MATHEW NESIAYALI
FACULTY AND MEMBER OF THE ADVISORY BOARD
Matthew Nesiayali, a Nigerian techpreneur and co-founder of Syncware Limited, is a junior software developer and data analyst with over 19 years of leadership experience across various industries. He has held key roles such as Director of People and Organization at Syncware Limited, Divisional HR Manager at AOS Orwell Limited, and Manager of Performance Management at Port Harcourt Electricity Distribution Company. Nesiayali’s passion for delivering high-impact training programs on topics like data analytics, data ethics, and human resource management makes him an asset to any global business venture.

THOMAS CHINWETALU
FACULTY MEMBER OF DOCENTI GLOBAL BUSINESS SCHOOL
Thomas Chiwetalu Kizito is an accomplished professional with extensive experience in curriculum design, corporate training, and business education. He holds a First-Class Bachelor’s degree in Software Engineering and has demonstrated academic excellence through his published research on Online Laboratory Diagnostic Systems, featured in the International Journal of Information Systems and Computer Sciences in 2023.His expertise spans corporate communication tools, remote work strategies, and digital transformation, making him an invaluable instructor for professionals and students alike. With a strong background in software engineering and project management, Thomas has contributed to product development, coordinated teams, and leveraged his technical acumen to deliver practical learning experiences.As a seasoned trainer, Thomas has carried out countless training sessions and consultations under Softworld, demonstrating expertise in talent acquisition, community management, and technical education. His ability to mentor and guide learners in mastering industry-relevant skills positions him as a distinguished instructor for corporate and academic settings.With a passion for education, technology, and leadership, Thomas Chiwetalu Kizito is well-equipped to lead training programs and academic courses that inspire, inform, and elevate the next generation of business and tech professionals.
MODULES
MODULE 1: INTRODUCTION TO MICROSOFT EXCEL
Description
Learning Outcomes
- Understand and apply basic Excel functions (LEFT, RIGHT, MID, UPPER, LEN, LOWER, PROPER, CONCATENATION).
- Utilize mathematical and statistical functions (MAX, MIN, TODAY, AVERAGE, SUM, SUMIF, SUMIFS, COUNT, COUNTIFS).
- Implement logical functions (IF, IFS, IF(OR), IF(AND)).
- Master lookup functions (VLOOKUP, HLOOKUP, INDEX, MATCH).
- Perform data analysis using conditional formatting and descriptive statistics.
MODULE 2: DATA PRESENTATION
Description
This module covers data visualization techniques using Excel’s charting tools. Participants will learn to create and format graphs, pie charts, and combo charts for effective data communication. The focus is on selecting the right chart for different data sets, enhancing clarity, and presenting insights in a visually compelling way.
Learning Outcomes
- Identify and apply the most appropriate chart type for different datasets.
- Format and customize graphs, pie charts, and combo charts for improved clarity.
- Use Excel’s charting tools to create dynamic and interactive visuals.
- Develop business and academic reports with clear and professional data presentations.
MODULE 3: POWER QUERY AND PIVOT TABLE
Description
This Diploma in Data Science program emphasizes data processing through Power Query and Pivot Tables, providing participants with essential skills in data analysis from Excel and data science and analytics. Learners will master techniques in artificial learning and data visualization tools, ensuring proficiency in extracting insights and making data-driven decisions.
Learning Outcomes
By completing this course, participants will acquire the ability to:
- Connect Excel to external data sources such as web pages, SQL Server, and Microsoft Power BI, applying industry-standard techniques in data analytics and machine learning.
- Clean and transform data using Power Query, ensuring structured data processing and efficient data science roadmap development.
- Create and manipulate Pivot Tables for data visualization and data analysis, enabling effective data analytics for business intelligence applications.
- Use calculated fields and connect multiple Pivot Tables, enhancing analytical proficiency in data science and artificial intelligence.
MODULE 4: DASHBOARD CREATION USING EXCEL
Description
Participants will learn how to create interactive and visually appealing dashboards in Excel. The course covers the design and creation of various types of charts and the use of slicers for data insights, enabling effective data presentation.
Learning Outcomes
- Design and create interactive dashboards in Excel.
- Utilize slicers to filter and analyze data within dashboards
- Create and customize various types of charts (graphs, pie charts, combo charts).
- Present data effectively using visual tools.
MODULE 5: INTROODUCTION TO POWER BI
Description
This course introduces Power BI, covering the interface, data connectivity, and ETL processes. Participants will learn to create data models, use DAX for measures, and develop comprehensive reports and dashboards.
Learning Outcomes
- Navigate and utilize the Power BI interface and workflow.
- Connect and clean data using Power BI’s ETL capabilities.
- Create data models, understand relationships, and ensure data integrity.
- Develop measures using DAX (Data Analysis Expressions).
- Visualize data and create comprehensive reports in Power BI
MODULE 6: CONNECTING AND CLEANING DATA
Description
This module focuses on Extract, Transform, and Load (ETL) processes, enabling participants to connect, clean, and structure datasets for analysis. The module covers essential table transformations, text cleaning, and numerical formatting techniques to ensure data accuracy and consistency.
Learning Outcomes
- Understand ETL processes for data integration and transformation.
- Perform table transformations to clean and restructure data.
- Use text functions to correct and standardize text entries.
- Apply number formatting techniques for financial and statistical analysis.
- Prepare clean datasets for use in Excel and Power BI dashboards.
MODULE 7: CREATING MODEL
Description
This module introduces data modeling in Excel and Power BI, focusing on structuring datasets for effective analysis. Participants will learn how to build a data model, understand relationships between tables, and define cardinality for accurate data representation
Learning Outcomes
- Understand data models and their importance in data analytics.
- Differentiate between data tables and lookup tables in modeling.
- Define and apply cardinality relationships for structured datasets.
- Improve data integrity and reporting efficiency using proper data modeling techniques.
MODULE 8: DATA VISUALIZATION AND REPORT
Description
This module introduces data visualization techniques and the best practices for creating effective reports. Participants will explore different visualization tools, learn how to select the most appropriate chart types, and apply dashboard visualization techniques to create insightful, interactive reports.
Learning Outcomes
- Understand and apply data visualization principles.
- Select appropriate visualization techniques for different datasets.
- Develop interactive dashboards for real-time reporting.
- Enhance report readability using formatting and storytelling techniques.
- Use Power BI, Excel, and Tableau to create dynamic and insightful visualizations.
MODULE 5: WRITING QUERIES WITH MICROSOFT SQL SERVER
Description
This course provides an in-depth understanding of SQL for data analysis. Participants will learn to write basic and advanced SQL queries, perform data manipulations, and integrate SQL data with Excel and Power BI for comprehensive analysis. The course culminates in a capstone project where participants apply their skills to real-world data scenarios.
Learning Outcomes
- Understand the fundamentals of SQL and relational databases
- Write basic SQL queries using SELECT, WHERE, AND, OR, NOT, NULL, ORDER BY.
- Apply advanced filters and aggregate functions (TOP, DISTINCT, SUM, AVG, MAX, MIN, GROUP BY).
- Perform data manipulations using date functions, string functions, and case expressions.
- Execute various types of joins (INNER, OUTER, LEFT, RIGHT, FULL).
- Create and manage SQL views.
- Understand and implement DDL commands (CREATE, DROP, ALTER).
- Integrate SQL data with Excel and Power BI.
- Optimize SQL queries for performance
- Design and present a capstone project utilizing SQL, Excel, and Power BI.



Certifications & Accreditations
Docenti Global Business School is accredited by QAHE (ISO 17011:2017)
Recognized by the American Accreditation Association (AAA)
Accredited by the Skill Development Council, Canada (SDC)


 Docenti School of Entrepreneurs


